Creating launch configuration for remote target system
When debugging an application on a remote target system, a launch configuration is necessary. This launch configuration contains the debugging information that Neuron Power Engineer needs.![]() The steps of this section are not required for the built-in PLC because the launch configuration needed by the built-in PLC is already provided in Neuron Power Engineer!
The steps of this section are not required for the built-in PLC because the launch configuration needed by the built-in PLC is already provided in Neuron Power Engineer!
-
If required, change to one of the perspectives for application creating.
-
In the project explorer, expand the runtime system folder that you have copied into the project. Expand the sub-folder
bin. Select the fileRTSLoaderin this sub-folder and open its properties (context menu, command Properties). -
In the dialog, select the project-relative path (incl. the runtime system folder) and copy this path into the clipboard.

-
Start the configuration creation for the remote target system: context menu of the project, select Debug As and Debug Configurations...
-
In the dialog, double-click C/C++ Remote Application in order to create a new launch configuration.

-
In the tab Main, define the following settings:
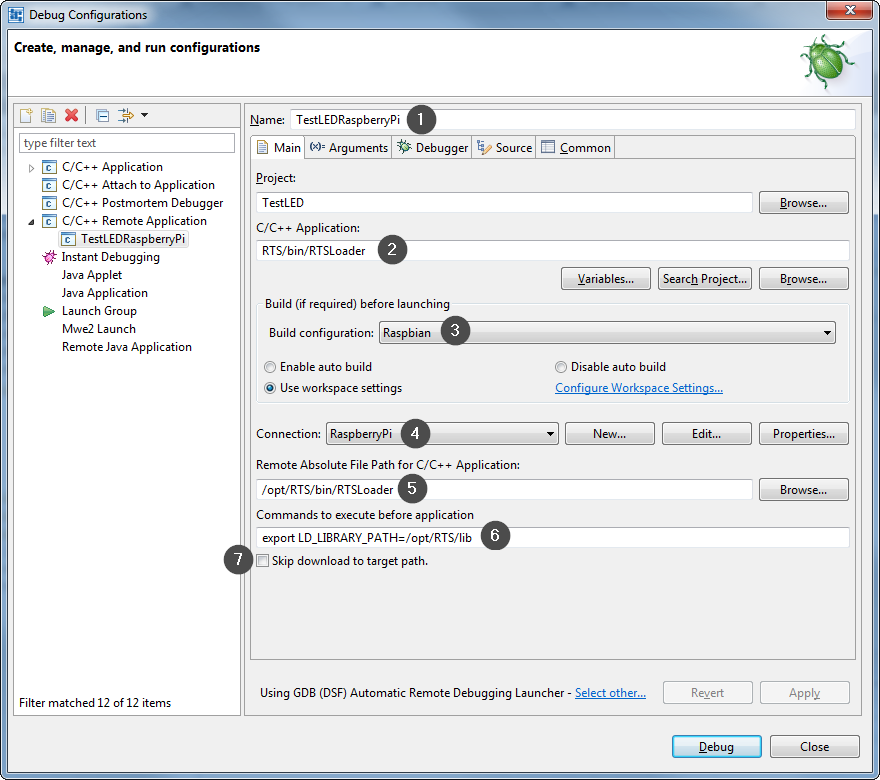
Here the details:-
Under Name, enter a meaningful name. Ideally this name will not contain umlauts or blanks.
-
Under C/C++ Application, insert the project-relative path to file
RTSLoaderthat is still in your clipboard. -
If required under Build configuration, select the platform for the target system. Alternative: Keep the suggested setting Select Automatically.
-
Under Connection, enter the connection for the remote target system as it has been created previously by using the perspective Remote System Explorer.
-
Under Remote Absolute File Path for C/C++ Application, enter the absolute path for the file
RTSLoaderas it is true for the target system. You might have to enter a different path than displayed in the above screenshot. -
Under Commands to execute before application, enter the command according to this syntax:
export LD_LIBRARY_PATH=/path/RTS-folder/lib
As value for the exported variableLD_LIBRARY_PATH, you have to enter the absolute path for the runtime system subfolderlibas it is true for the target system. You might have to enter a different path than displayed in the above screenshot. -
Make sure that Skip download to target path is unchecked.
-
-
In tab Arguments, enter the parameters for starting the runtime system and the absolute path for the runtime system subfolder
PLCas it is true for the target system:-v -b/path/RTS-folder/PLC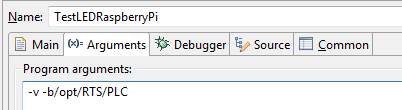
-
In tab Debugger, define the debugger settings:
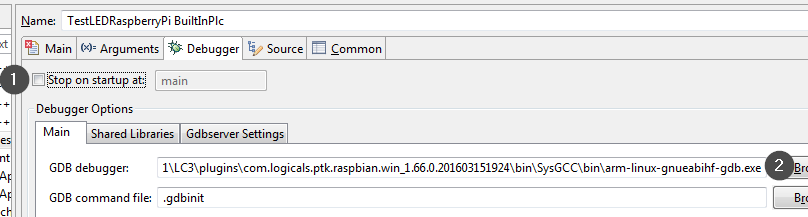
Here the details:
-
Make sure that Stop on startup at is unchecked.
-
Under GDB debugger, enter the path to the corresponding debugger in your Neuron Power Engineer installation.
Example:
Target system
Path to the GDB debugger within the folder to which Neuron Power Engineer has been installed
Raspberry Pi
LC3\plugins\com.logicals.ptk.raspbian.win_x.y.zaaaaaa\bin\SysGCC\bin\arm-linux-gnueabihf-gdb.exex.y.zaaaaaais a placeholder for the respective version number
-
-
In tab Source, add the project:
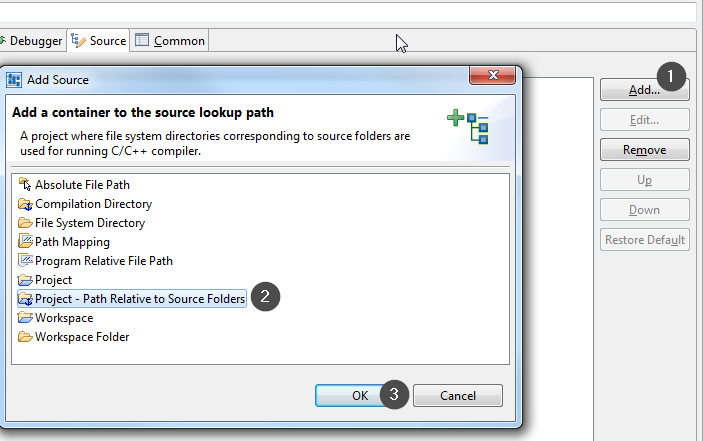
Here the details:-
In the tab, click Add...
-
In the dialog, select Project - Path Relative to Source Folders and click OK.
-
-
In tab Common, select Shared file. Subsequently, you will be able to start the later debugging sessions more quickly.

-
In dialog Debug Configurations, click Apply at first to have all settings saved in the
.launchfile. Then click Debug in order to start the debugging session for the application on the remote target system.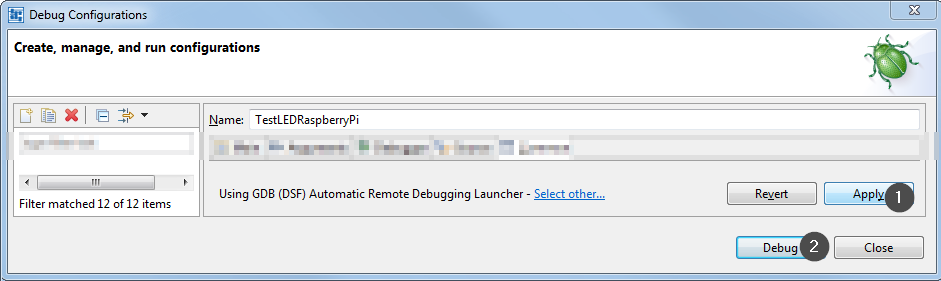
If the message
Warning: Unable to find dynamic linker breakpoint function. GDB will be unable to debug shared library initializers and track explicitly loaded dynamic codeis displayed when starting the debugging session, you have to replace a line in the.gdbinitfile by the textset sysroot remote:/(see under "Displaying relevant files within the project explorer"). -
Terminate the debugging session as described under "Terminating the debugging" before you set the breakpoints as described in the next step.